-
Ads
- location_on
Outdoor
- panorama
Billboard - digital_out_of_home
Digital
- transportation
Transit
- directions_bus
Bus
- transfer_within_a_station
Bus Stop
- road
Street
- weekend
Bench
- storefront
Mall
- local_airport
Airport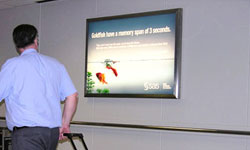
- local_taxi
Taxi/Uber
- local_gas_station
Gas Stn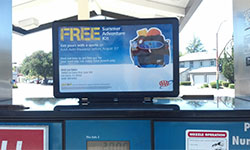
- local_grocery_store
Grocery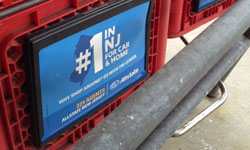
- local_convenience_store
C-Store
- local_cafe
Coffee
- local_pizza
Pizza
- local_bar
Bar
- attach_money
Cash
- subway
Subway
- train
Train
- flight
Aerial
- wc
Restroom
- local_shipping
Mobile
- electric_rickshaw
Pedicab
- movie
Movie
- meeting_room
Door
- local_laundry_service
Laundromat
- elderly
Senior
- fitness_center
Gym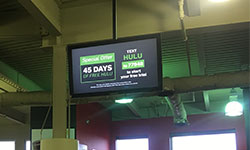
- content_cut
Hair/Nail
- school
College
- diversity_3
Hispanic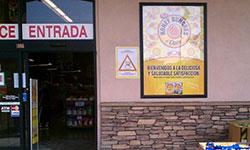
- cooking
Food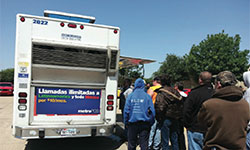
- local_hospital
Medical
- place
Place-Based - elevator
Elevator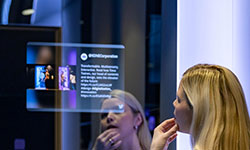
- ballot
Political
- stadium
Stadium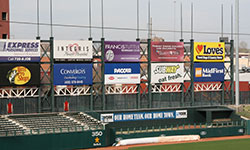
- event
Event
- groups
Convention - nature
Wild
- radio
Radio
- location_on
- See
- Contact
- Pricing
- location_on
Outdoor - panorama
Billboard - digital_out_of_home
Digital - transportation
Transit - directions_bus
Bus - transfer_within_a_station
Bus Stop - road
Street - weekend
Bench - storefront
Mall - local_airport
Airport - local_taxi
Taxi/Uber - local_gas_station
Gas Stn - local_grocery_store
Grocery - local_convenience_store
C-Store - local_cafe
Coffee - local_pizza
Pizza - local_bar
Bar - attach_money
Cash - subway
Subway - train
Train - flight
Aerial - wc
Restroom - local_shipping
Mobile - electric_rickshaw
Pedicab - movie
Movie - meeting_room
Door - local_laundry_service
Laundromat - elderly
Senior - fitness_center
Gym - content_cut
Hair/Nail - school
College - diversity_3
Hispanic - cooking
Food - local_hospital
Medical - place
Place-Based - elevator
Elevator - ballot
Political - stadium
Stadium - event
Event - groups
Convention - nature
Wild - radio
Radio - campaign
Campaigns - record_voice_over
Testimonials - diversity_3
Clients - quiz
FAQ - emoji_events
Benefits - menu_book
Studies - description
Specs - lightbulb
Tips - request_quote
Static vs. Digital - ads_click
Digital Works - view_in_ar
Billboard Preview - design_services
Design - upload
Upload
Airport Ads
Zoom in/out on map to see more.


Description
- Airport Advertising: Static and digital displays in and around domestic and international airports.
- Coverage: Airport advertising company offers low rates, reaching travelers before and after flights.
- Effectiveness: Competitive rates; visible to travelers throughout the airport journey.
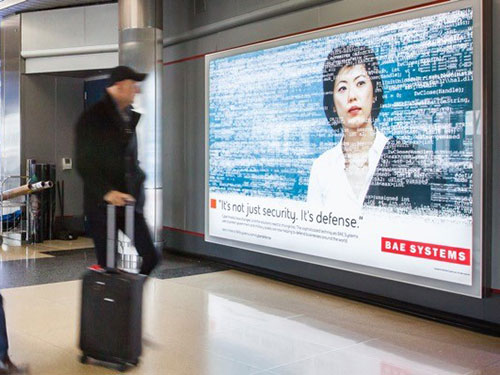
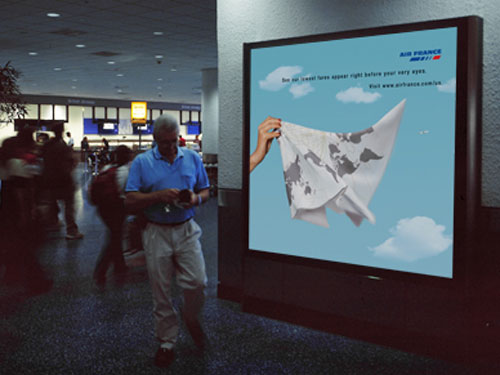
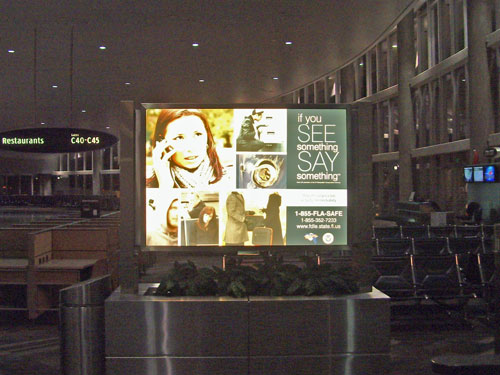
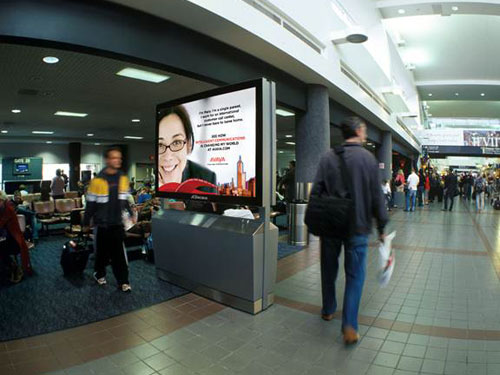
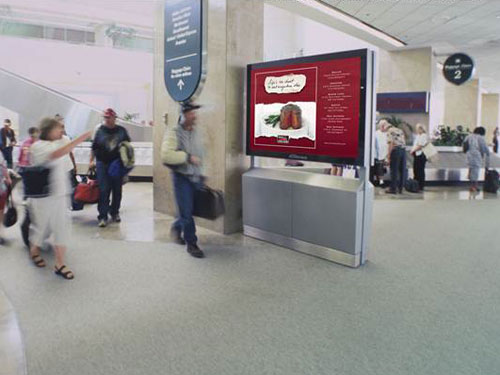
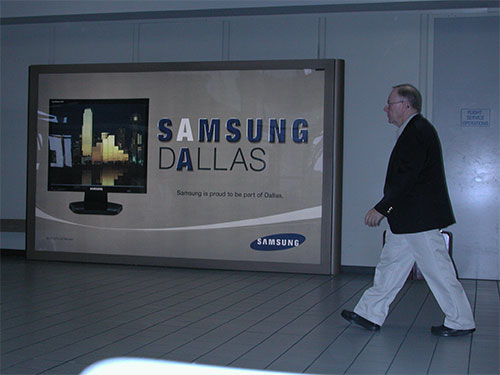
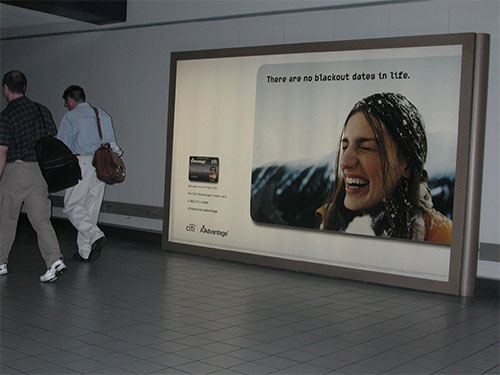
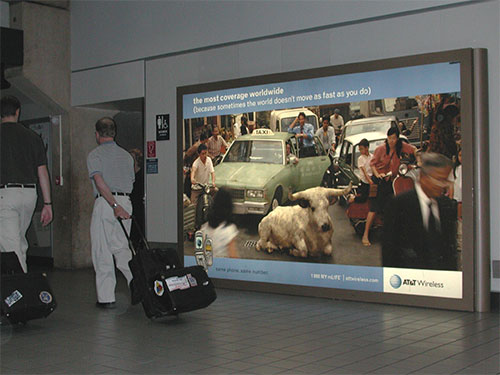
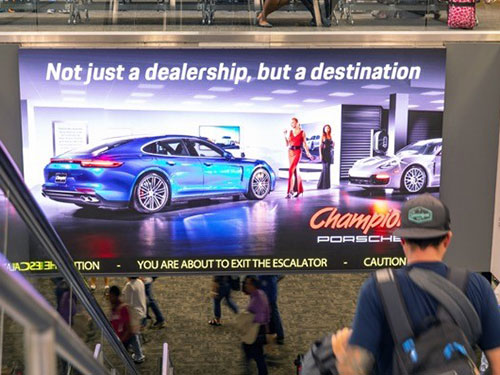
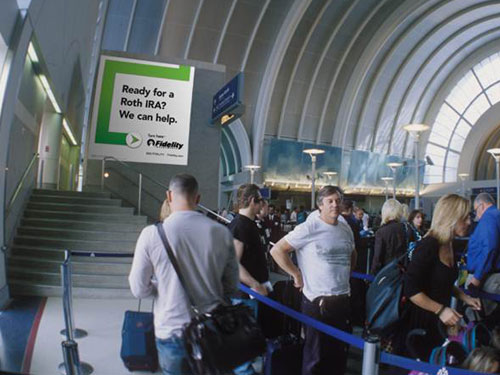
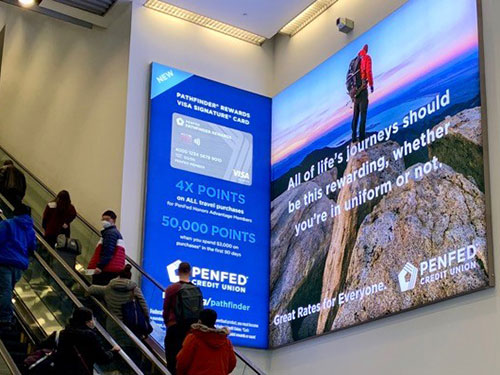
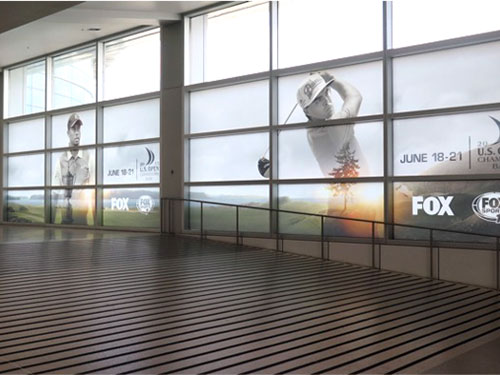
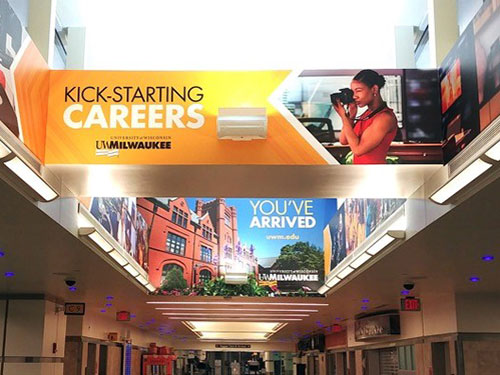
What is airport advertising? The definition of airport advertising is static and digital displays that are placed in and around domestic and international airports that deliver a message on behalf of an advertiser.
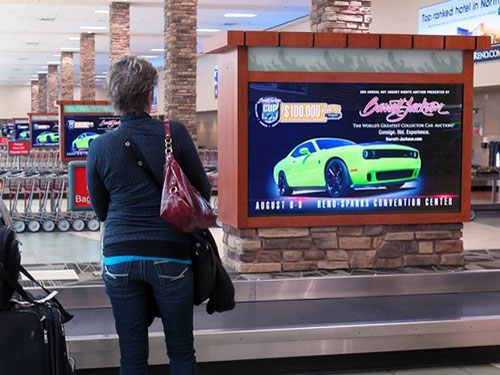
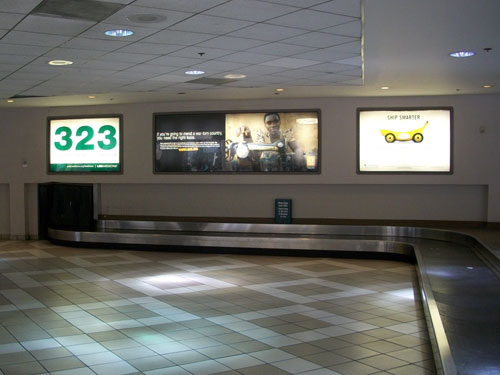
Blue Line Media is an airport advertising company that offers low airport ad rates. Airport advertising signs (sometimes referred to as airport billboards) reach all kinds of people before and after their flights. The airport signs are visible to all travelers -- while they walk through the concourse or terminal to the gate for a flight departure, or as they return to baggage claim from a trip.
Airport advertising rates are competitive when compared to other media; especially when obtained through one of the airport advertising companies that offers airport media, such as BLM.
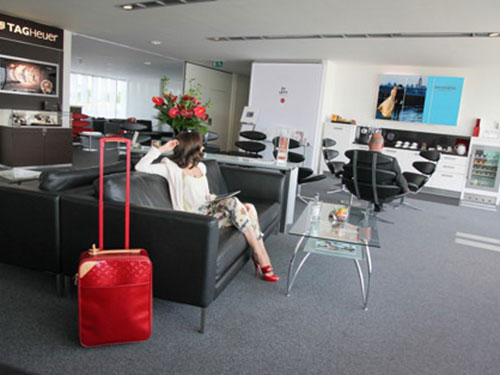
Also reach wealthy consumers with advertising at private jet aircraft facilities - also known as Fixed Based Operators (FBOs).
Also inquire about the CNN television network for advertising available across various cities.
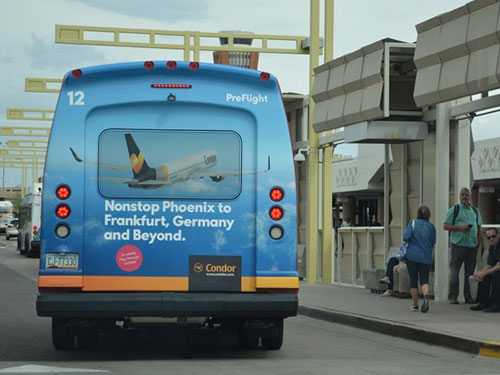
Airport shuttle/bus advertising on car rental transportation and parking lot/garage shuttles and buses is also available.
| Car Rental Buses/Shuttles | Advantage, Alamo, Avis, Dollar, Enterprise, Fox, Hertz, Payless, National, Sixt, Thrifty and others |
|---|---|
| Parking Lot/Garage Buses/Shuttles | Park N Fly, PreFlight and Parking Spot and others |
Recent Campaigns
CACI Advertised on Airport Cell Phone Charging Stations in Terminals
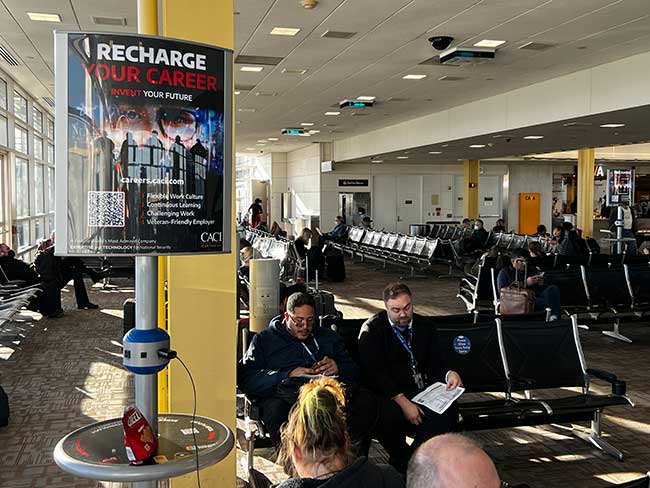
CACI advertised on airport charging stations in terminals to reach potential recruits for open job positions.
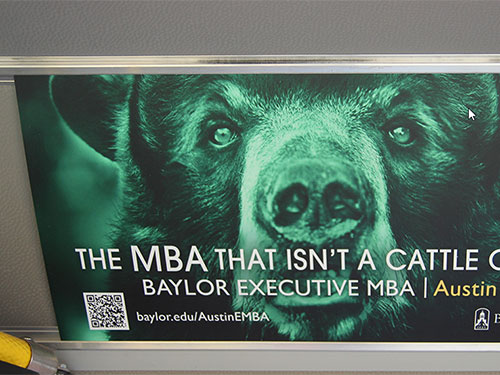
Intel Corp Advertised Inside Airport to Reach Convention Attendees
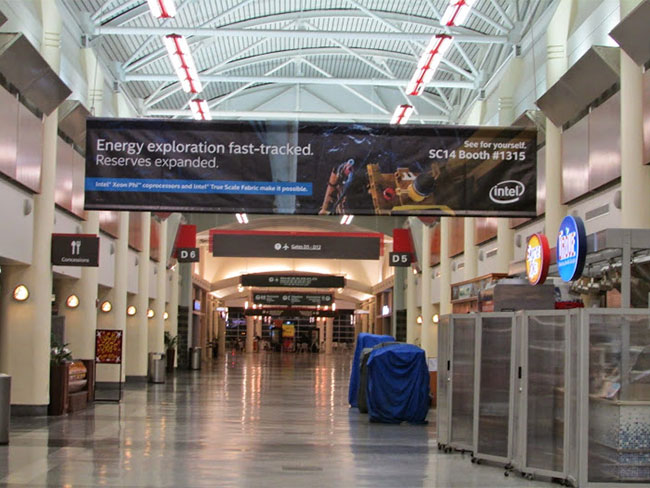
Intel used airport ads to reach people who are attending the supercomputing convention. The ads are on banners in high exposure locations geared towards arriving passengers.
The ads invite arriving passengers to visit them at Intel's convention booth.
TSA Advertised in Airports on Digital/LED/Video Advertising Displays
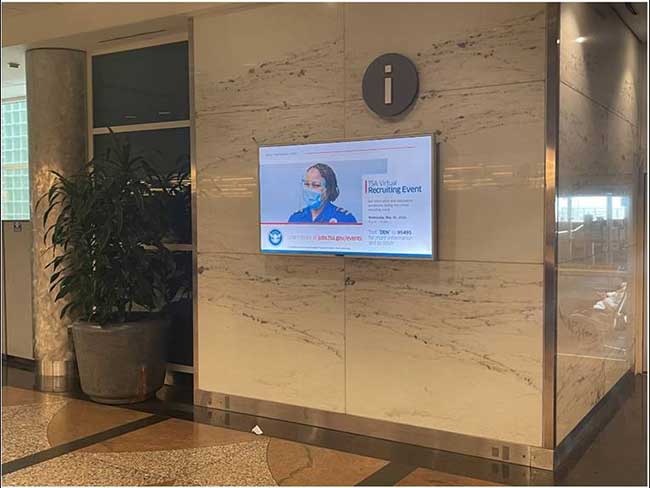
The TSA used digital/LED/video airport ads to recruit new candidates to open job positions.
Rates
General:
Estimated per display per period (4 weeks). For more specific pricing: Pricing
| Format | Rate |
|---|---|
| Backlit Diorama (Gate/Terminal and Baggage Claim) |
$3,500 - $9,900 |
| Gate Info Display | $1,500 - $2,500 |
| Spectacular | $11,500 - $19,900 |
| Digital | $3,500 - $9,500 |
| Airport Banner / Tension Fabric Display (TFD) | $15,000 - $30,000 |
| Private Jet Airport Display | $5,000 - $10,000 |
| Airport Shuttle/Bus | $4,000 - $8,000 per package of displays per 4 week period |
Range of rates depends on timing and market.
Minimum Purchase:
Minimum purchase requirement is $5,000 per market or higher (depending on market), which may be spread over displays and periods. May be reduced in certain cases.
Discounts:
Government and nonprofit organizations are eligible for a discount on airport ad displays.
Specs/Imps
FAQ
1. What is airport advertising?
Airport advertising is out-of-home media placed throughout airports to reach travelers, greeters, and airport staff via high-visibility displays and digital screens.
2. Where do airport ads appear inside an airport?
Common placements include arrivals areas, baggage claim, ticketing, security queues, concourses, gates, lounges, jet bridges, parking shuttles, and digital screen networks across terminals.
3. Why is airport advertising effective?
Airports combine high foot traffic with long dwell time, creating repeated exposures while travelers wait, walk, and queue in a premium environment.
4. Who will see my airport ads?
Primarily air travelers, plus people meeting travelers and airport employees—audiences that often include business and leisure travelers depending on the airport.
5. How is airport advertising typically priced?
Pricing varies by airport, terminal location, and format (static vs digital). It’s usually quoted by time period (often 4 weeks) and by the number of units or screens.
6. Can I buy specific terminals or areas (like baggage claim)?
Often yes—many airport programs allow buying by terminal, concourse, or zone (arrivals vs departures), subject to inventory availability.
7. What types of airport ad formats are available?
Formats include large posters, backlit displays, digital screens, video walls, baggage claim units, directory takeovers, floor graphics, wall wraps, and other high-impact placements depending on the airport.
8. What creative works best for airport ads?
Strong visuals, premium branding, and concise messaging work best. Airports are ideal for high-impact awareness creative, with optional QR codes or short URLs for action.
9. What are typical timelines for booking and creative delivery?
Reserve early since premium inventory can sell out. Static placements often require production lead time, while digital placements can typically launch faster once approved and trafficked.
10. How is airport advertising reported or verified?
Digital placements often provide proof-of-play reporting; static placements typically provide proof of posting and may include photo documentation, depending on the airport program.
Get Pricing
Free $ For Nonprofits

Campaigns
-
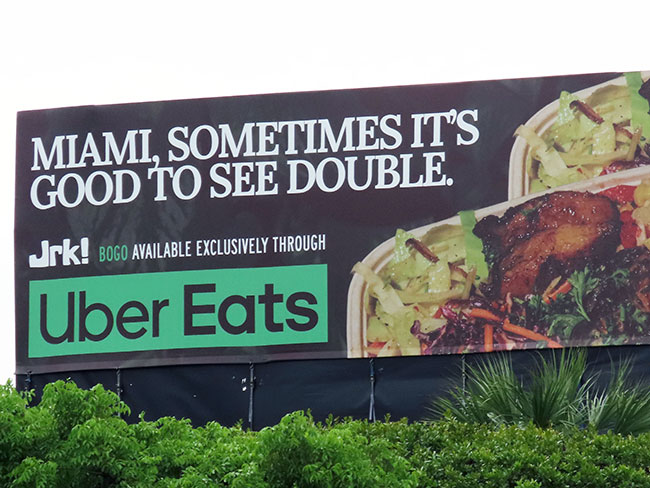
Uber Eats Advertises Partner Restaurants on Billboards.
See the ads. >> -
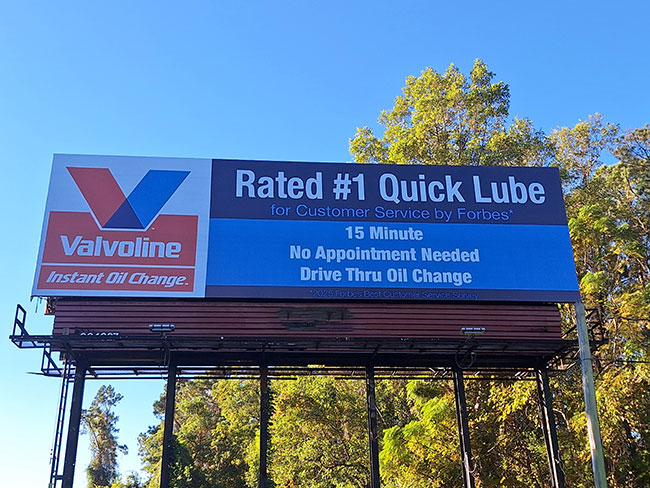
Valvoline Advertises on Out of Home Displays — Roadside Billboards, Supermarket Shopping Carts and Residential Door Hangers — to Support Oil Change Shops.
See the ads. >> -

Advertise to FIFA World Cup Fans With Out of Home / Outdoor Ads, Including Billboards.
See the options. >> -

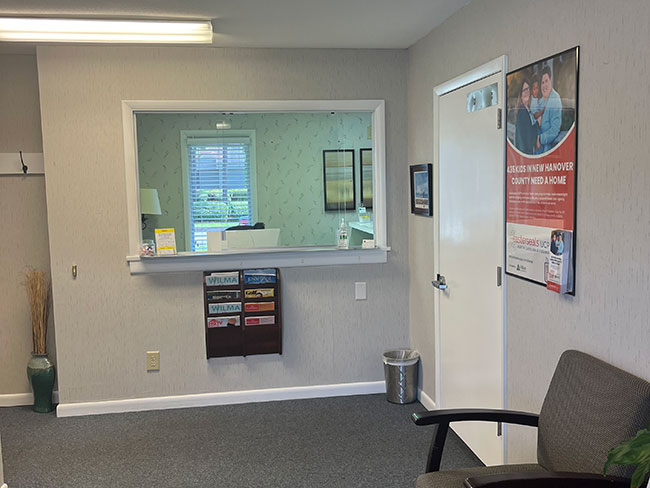
Health Insurance Company's Open Enrollment Place-Based Ads in Medical Doctors/Physicians Offices, Grocery/Convenience Stores, Laundromats, Pharmacies and Churches.
See the ads. >> -

Ohio's Get Out the Vote Campaign Advertises on Gas Station Pump Toppers For Nov Election.
See the ads. >> -
Easterseals Ads in Doctor Offices, Bar/Restaurant Restrooms, Supermarket Shopping Carts and Delivery Trucks.
See the ads. >> -

Fashion Retailer Wild / Wheat Paste Ads Postings Promote New Store.
See the ads. >> -
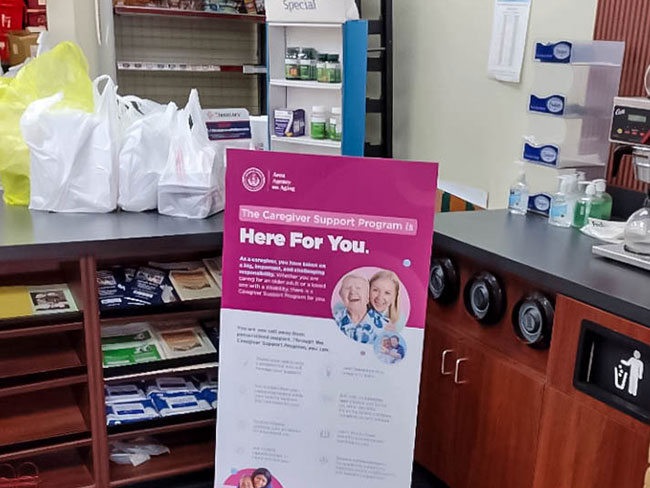
Government Health Dept Ads on Standees/Banners in Pharmacies.
See the ads. >> -
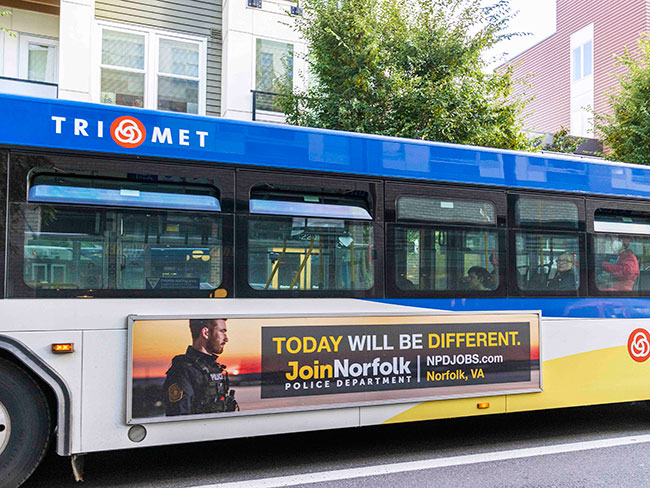
Police / Law Enforcement Transit / City Bus Ads to Recruit Employees.
See the ads. >>
Testimonials
One call to Blue Line Media provides us with any advertising option in any city across the country.
Matt Freeman
PETA
Blue Line Media has executed multiple government PSA campaigns in multiple U.S. cities, thereby giving our clients a truly national reach.
Sarah Parada
Porter Novelli
Working with Blue Line Media is a delight.

Judith DeCamp
ACS Quantum
Blue Line Media is extremely helpful in delivering advertising media in any city we want across the country.
Sheldon de Souza
Better World Advertising
Markets
Airport Traveler Demographics
Check out which airports have the highest number of business travelers:
| Estimated Business Travel - Top 20 Markets | |||||
|---|---|---|---|---|---|
| Market | ACI Data | Scarborough Data | |||
| ACI Annual Ticketed Passengers | Approx. Ticketed Business Travelers per DMA** (Scarborough "% Air Traveler" applied to ACI ticketed passenger number) | % of Adult Air Travelers that have taken 1+ business trips in the past year* (Scarborough) | # of Adult Air Travelers that have taken 1+ business trips in the past year* (Scarborough) | Index of Adult Air Travelers that have taken 1+ business trips in the past year* (Scarborough) | |
| Atlanta | 92,38,023 | 38,618,612 | 41.8% | 836,085 | 239 | Dallas | 57,744,554 | 25,349,859 | 43.9% | 998,683 | 231 |
| Los Angeles | 61,862,052 | 22,827,097 | 36.9% | 1,886,664 | 262 |
| Chicago | 66,659,709 | 22,197,683 | 33.3% | 1,118,690 | 221 |
| Denver | 52,849,132 | 19,184,235 | 36.3% | 601,313 | 189 |
| Charlotte | 39,043,708 | 15,461,308 | 39.6% | 277,199 | 325 |
| San Francisco | 40,810,141 | 15,018,132 | 36.8% | 1,073,793 | 198 |
| New York (JFK) | 47,683,529 | 14,352,742 | 30.1% | 2,077,032 | 239 |
| Houston | 40,128,953 | 14,285,907 | 35.6% | 657,321 | 250 |
| Miami | 38,314,389 | 13,563,294 | 35.4% | 509,663 | 233 |
| Phoenix | 40,591,948 | 12,705,280 | 31.3% | 552,445 | 212 |
| Las Vegas | 40,560,285 | 11,113,518 | 27.4% | 178,982 | 229 |
| Orlando | 35,426,006 | 10,734,080 | 30.3% | 461,187 | 194 |
| Detroit | 32,406,159 | 10,402,377 | 32.1% | 430,327 | 274 |
| New York (EWR) | 33,711,372 | 10,147,123 | 30.1% | 2,077,032 | 239 |
| Minneapolis | 33,118,499 | 9,670,602 | 29.2% | 427,754 | 236 |
| Philly | 30,839,175 | 9,467,627 | 30.7% | 763,211 | 253 |
| Boston | 28,907,938 | 9,423,988 | 32.6% | 829,655 | 213 |
| Seattle | 32,467,007 | 9,155,696 | 28.2% | 526,028 | 202 |
| New York (LGA) | 24,122,478 | 7,260,866 | 30.1% | 2,077,032 | 239 |
| ATL Sample: According to Scarborough, 41.8% of Adult Air Travelers (836,085 adults) in the Atlanta DMA have taken 1+ business trips in the past year and they are 139% more likely to do so (index 239) compared to the average adult in the Atlanta DMA. Given this knowledge, we can apply this percentage to our annual ACI ticketed passenger count and estimate that 38.6 million passengers (92.4 million x 41.8%) in Atlanta have flown for business at least once in the past year. | |||||
|
* The percentages, numbers, and indices that we get from Scarborough reflect the percentage of Air Travelers who have taken a business trip in the respective DMA, not the actual amount of ticketed passengers who have taken a business trip in said DMA. For example, Sally has had ten tickets for 10 different business trips departing out of dma x, but she is only counted once in the Scarborough data. ** Applying the Scarborough percentage of Air Travelers that have taken at least one business trip over the past year is a good estimate as to what % of ACI ticketed passengers have flown for business, but is not a comparison of the same variables. |
|||||
Copyright 2026 Blue Line Media Inc
Blue Line Media is not the owner or exclusive provider of advertising formats presented on this website.
Not all images represent ads placed by Blue Line Media. Images may be subject to copyright. Names and trade and service marks are property of their owners and are not intended to endorse Blue Line Media.
In accordance with its Accessibility Statement, Blue Line Media is committed to ensuring accessibility of its website. To report an accessibility issue, request accessibility assistance regarding website content, or to request a specific electronic format, please contact the accessibility coordinator at 800-807-0360 or complete the form. Reasonable efforts will be made to accommodate all needs.
By using this website, you consent to the placement and storing of cookies on your computer by this website. These cookies are used to collect information about how you interact with our website and allow us to remember you. We use this information in order to improve and customize your browsing experience and for analytics and metrics about our visitors both on this website and other media. To find out more about the cookies we use, see our Privacy Policy.
The Geopath Audience Location Measurement data is provided by the GeoPath, Inc. New York, New York. © Copyright 2026 All Rights Reserved.
Certain info and images may be AI-generated. Double-check important info and images.
BACK TO TOP